.NET 8 vs .NET 10 EF Core Performance Benchmarks Across SQLite, InMemory, and Azure SQL
🚀
Over the past few weeks, I’ve been benchmarking Entity Framework Core to understand what .NET 10 actually improves in real workloads.
Not release notes. Not marketing slides. Actual code. Actual queries. Actual numbers.
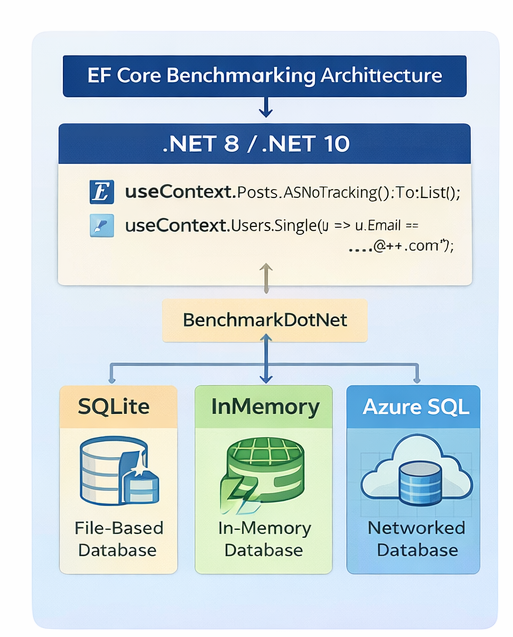
This article compares .NET 8 vs .NET 10 using the same EF Core codebase across three very different database providers:
🗂 SQLite (file-based)
⚡ InMemory (no I/O, runtime-focused)
☁️ Azure SQL (real networked SQL Server)
The goal is simple: understand where .NET 10 helps, where it doesn’t, and why.
🧪 Benchmark Setup Runtime & Tooling
BenchmarkDotNet for measurement
Same codebase, same queries, same dataset
Only runtime and provider change
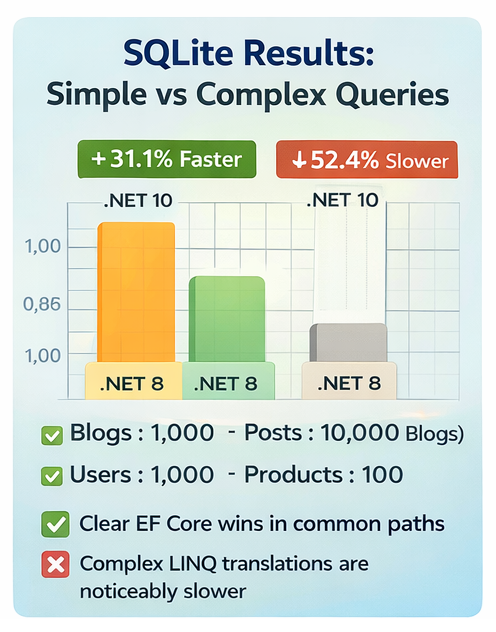
Sample Data Shape Blogs : 1,000 Posts : 10,000 (1-to-many with Blogs) Users : 1,000 Products : 100
This dataset intentionally mixes:
Simple queries
Tracking vs AsNoTracking
Inserts, updates, deletes
Complex LINQ projections
Raw SQL paths
🗂 SQLite Provider Results
| Benchmark | .NET 8 Mean | .NET 10 Mean | Improvement | .NET 8 Allocated | .NET 10 Allocated |
|---|---|---|---|---|---|
| Ef.AsNoTracking | 102,674.46 ns | 75,025.46 ns | [+] +26.9% | 42281 B | 45873 B |
| Ef.BulkInsert | 31,672,144.12 ns | 29,318,670.42 ns | [+] +7.4% | 11538680 B | 10309430 B |
| Ef.BulkUpdate | 123,968,292.43 ns | 128,406,550.20 ns | -3.6% | 59492305 B | 57383714 B |
| Ef.Caching | 36.54 ns | 29.27 ns | [+] +19.9% | 64 B | 0 B |
| Ef.ColdStart | 104,321.34 ns | 102,538.32 ns | +1.7% | 59567 B | 62868 B |
| Ef.ComplexQuery | 114,037.51 ns | 173,775.50 ns | [-] -52.4% | 42016 B | 54736 B |
| Ef.Delete | 1,654,737.89 ns | 1,727,686.80 ns | -4.4% | 79423 B | 82730 B |
| Ef.Insert | 873,156.78 ns | 895,244.05 ns | -2.5% | 66383 B | 68131 B |
| Ef.LinqQuery | 67,529.55 ns | 64,983.62 ns | +3.8% | 35168 B | 37696 B |
| Ef.QueryTop100 | 54,568.43 ns | 57,398.64 ns | [-] -5.2% | 34513 B | 37569 B |
| Ef.RawSql | 65,609.71 ns | 61,233.70 ns | [+] +6.7% | 38185 B | 40384 B |
| Ef.SimpleQuery | 36.12 ns | 24.89 ns | [+] +31.1% | 88 B | 56 B |
| Ef.Update | 104,024.48 ns | 101,779.97 ns | +2.2% | 60140 B | 63236 B |
SQLite is lightweight and fast, but its query planner and execution model can behave very differently from server-based databases.
Key Observations
✅ Clear wins in common paths
SimpleQuery: +31.1%
AsNoTracking: +26.9%
Caching: +19.9%
RawSql: +6.7%
BulkInsert: +7.4%
⚠️ Noticeable regressions
ComplexQuery: -52.4%
QueryTop100: -5.2%
What This Means
.NET 10 improves hot paths and low-level execution, but complex LINQ translations on SQLite can amplify regressions. This isn’t unique to .NET 10. SQLite has always been sensitive to query shape.
⚡ InMemory Provider Results
| Benchmark | .NET 8 Mean | .NET 10 Mean | Improvement | .NET 8 Allocated | .NET 10 Allocated |
|---|---|---|---|---|---|
| AsNoTracking | 39,156.38 ns | 38,308.54 ns | +2.2% | 103378 B | 95986 B |
| BulkInsert | 3,644,025.27 ns | 3,777,690.15 ns | -3.7% | 4039985 B | 3351774 B |
| BulkUpdate | 7,193,296.40 ns | 7,514,367.05 ns | -4.5% | 52364986 B | 44947268 B |
| Caching | 36.39 ns | 30.45 ns | [+] +16.3% | 64 B | 0 B |
| ColdStart | 61,243.14 ns | 59,822.17 ns | +2.3% | 103376 B | 95476 B |
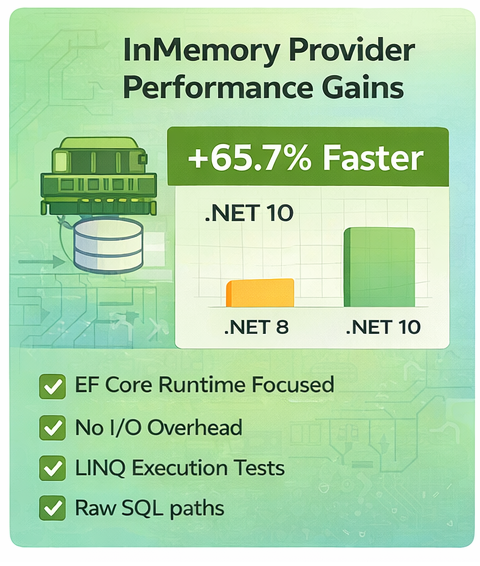
| ComplexQuery | 1,333,247.11 ns | 456,938.87 ns | [+] +65.7% | 1175145 B | 985288 B |
| Delete | 41,059.23 ns | 35,994.73 ns | [+] +12.3% | 34234 B | 33132 B |
| Insert | 33,996.85 ns | 31,247.18 ns | [+] +8.1% | 30794 B | 30396 B |
| LinqQuery | 51,215.60 ns | 48,373.73 ns | [+] +5.5% | 108488 B | 100304 B |
| QueryTop100 | 39,525.17 ns | 37,632.59 ns | +4.8% | 98810 B | 90882 B |
| RawSql | NA | NA | N/A | NA | NA |
| SimpleQuery | 36.86 ns | 25.55 ns | [+] +30.7% | 88 B | 56 B |
| Update | 62,905.66 ns | 63,223.70 ns | -0.5% | 95992 B | 87882 B |
This provider removes disk and network entirely. What you measure here is mostly:
EF Core internal behavior
LINQ execution
Runtime improvements
And this is where .NET 10 really stands out.
Highlights
🔥 Big improvements
ComplexQuery: +65.7%
SimpleQuery: +30.7%
Caching: +16.3%
Delete: +12.3%
Insert: +8.1%
⚖️ Minor regressions
BulkInsert and BulkUpdate are slightly slower
What This Means
When I/O is removed, .NET 10’s runtime improvements are very visible. If your app relies heavily on complex LINQ queries or projections, this is the strongest signal that upgrading can help.
☁️ Azure SQL Provider Results
| Benchmark | .NET 8 Mean | .NET 10 Mean | Improvement | .NET 8 Allocated | .NET 10 Allocated |
|---|---|---|---|---|---|
| AsNoTracking | 222,421.48 ns | 202,049.18 ns | [+] +9.2% | 54011 B | 42650 B |
| BulkInsert | 18,761,982.45 ns | 18,077,035.58 ns | +3.7% | 9728528 B | 8354063 B |
| BulkUpdate | NA | 96,384,991.95 ns | N/A | NA | 25233403 B |
| Caching | 37.60 ns | 30.04 ns | [+] +20.1% | 64 B | 0 B |
| ColdStart | 246,371.30 ns | 239,864.02 ns | +2.6% | 90743 B | 90542 B |
| ComplexQuery | 1,597,342.25 ns | 1,699,335.67 ns | [-] -6.4% | 62658 B | 60482 B |
| Delete | 2,809,270.73 ns | 3,322,021.47 ns | [-] -18.3% | 111285 B | 108805 B |
| Insert | 375,608.11 ns | 356,960.98 ns | +5.0% | 98763 B | 97103 B |
| LinqQuery | 186,734.97 ns | 189,260.08 ns | -1.4% | 33657 B | 33985 B |
| QueryTop100 | 211,699.48 ns | 201,654.46 ns | +4.7% | 36722 B | 34346 B |
| RawSql | 193,049.71 ns | 195,063.53 ns | -1.0% | 37402 B | 36929 B |
| SimpleQuery | 38.85 ns | 25.15 ns | [+] +35.3% | 88 B | 56 B |
| Update | 260,622.89 ns | 246,550.18 ns | [+] +5.4% | 91013 B | 90647 B |
Azure SQL introduces:
Network latency
Server-side execution plans
Real-world variability
This makes results more realistic and more nuanced.
Improvements
✅ Consistent gains
SimpleQuery: +35.3%
Caching: +20.1%
AsNoTracking: +9.2%
Update: +5.4%
Insert: +5.0%
⚠️ Regressions
Delete: -18.3%
ComplexQuery: -6.4%
RawSql and LinqQuery mostly flat
What This Means
Once network and server execution dominate, runtime improvements matter less. .NET 10 still helps, but it won’t magically overcome latency or poor query plans.

🧠 Patterns Across All Providers
After running all three providers, a few patterns are very clear:
1️⃣ Simple queries consistently get faster 2️⃣ Caching improvements are real and repeatable 3️⃣ Complex queries are provider-dependent 4️⃣ InMemory exaggerates wins 5️⃣ Azure SQL dampens them
There is no single “.NET 10 is X% faster” number that makes sense.
📉 Why Some Regressions Exist
A regression doesn’t automatically mean “worse code.”
Possible reasons include:
Different query plans
Changed execution order
Provider-specific behavior
Runtime tradeoffs favoring common cases
This is exactly why benchmarking your own workload matters more than reading generic numbers.
🔁 Why I’m Sharing This
These results reflect:
My machine
My dataset
My environment
Change any of those and the numbers will change too.
That’s why I’m sharing the benchmarks and encouraging others to run them:
Different CPUs
Different cloud regions
Different data sizes
Different providers
Benchmarks are a starting point, not a verdict.
🤝 Want to Compare Results?
If you’re running EF Core on:
SQLite
InMemory
SQL Server or Azure SQL
I’d love to see what you get on your setup.
Different environments tell a better story than any single benchmark ever could.
🏁 Final Thoughts
.NET 10 brings real, measurable improvements to EF Core, especially in:
Simple queries
Caching
LINQ-heavy workloads
But databases are complex systems. Runtime upgrades help, but they don’t replace good schema design, indexing, and query discipline.
Measure first. Upgrade second.
If you want the repo or want to discuss results, feel free to reach out 👋
No comments yet. Be the first to share your thoughts!